ALMAGAL Continuum Emission
The continuum emission at 1.3 mm of the 1013 clumps observed by the ALMAGAL survey revealed the complexity and the different morphologies that can characterize different high-mass star-forming regions. Some clumps show relatively extended emission that is mostly resolved at the 1000 au scale, in some fields the emission is distinctively filamentary, while in others can be extended with an irregular shape. On the contrary, other fields show little extended emission, with only compact sources. In this page we gave access to images preview of the ALMAGAL continuum emission for each source, together with the results of the analysis performed on this dataset.
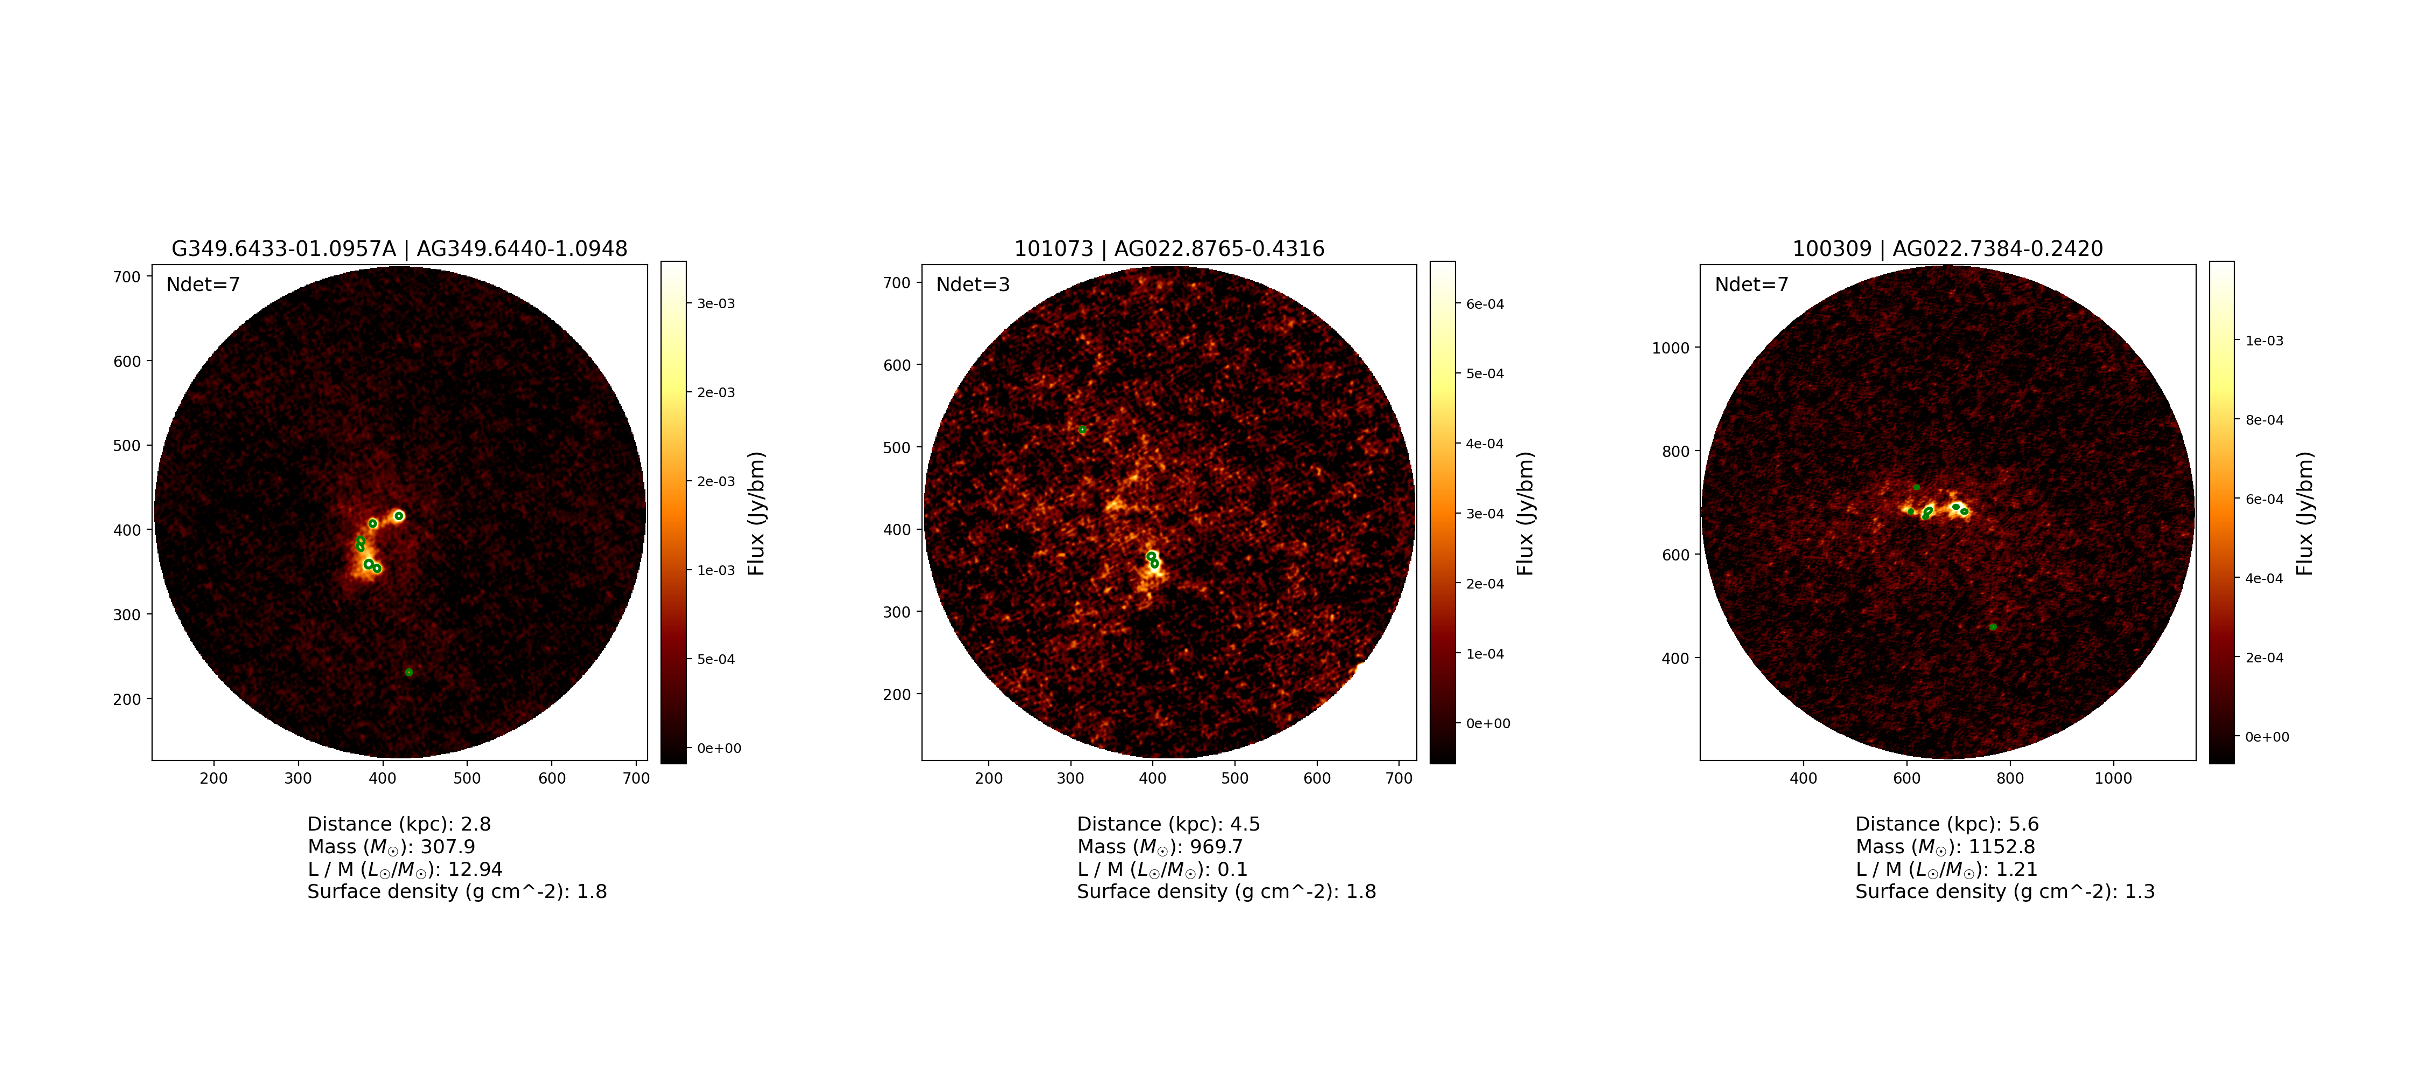
Compact sources catalog
Coletta et al. 2025 (download here) analyzed the continuum emission of the ALMAGAL targets at a resolution of ~1000 au to extract the catalog of the compact sources. The analysis has been performed using the algorithm CuTEx, which identifies compact sources as maxima of curvature in maps by analyzing their second derivatives. This method allows an easier identification of compact sources, which stand out in the curvature images, while diffuse and background emission is strongly dampened.
The ALMAGAL compact sources catalog (available from CDS) includes 6348 cores detected in 844 clumps (83% of the total), with a number of cores per clump between 1 and 49 (median of 5). The estimated core diameters are mostly within ~800–3000 au (median of 1700 au). We assigned core temperatures based on the L/M of the hosting clump, and obtained core masses from 0.002 to 345 M⊙ (complete above 0.23 M⊙), exhibiting a good correlation with the core radii (M∝R2.6).
A preview of the continuum emission at 1000 au resolution for each ALMAGAL target, together with the results of the cores extraction on the target can be access at the link below. For each source, we report in green the ellipses that identify the compact cores, and we report in the top left corner the total number of cores detected. On the bottom of each image we give some of the properties of the source at clump level.
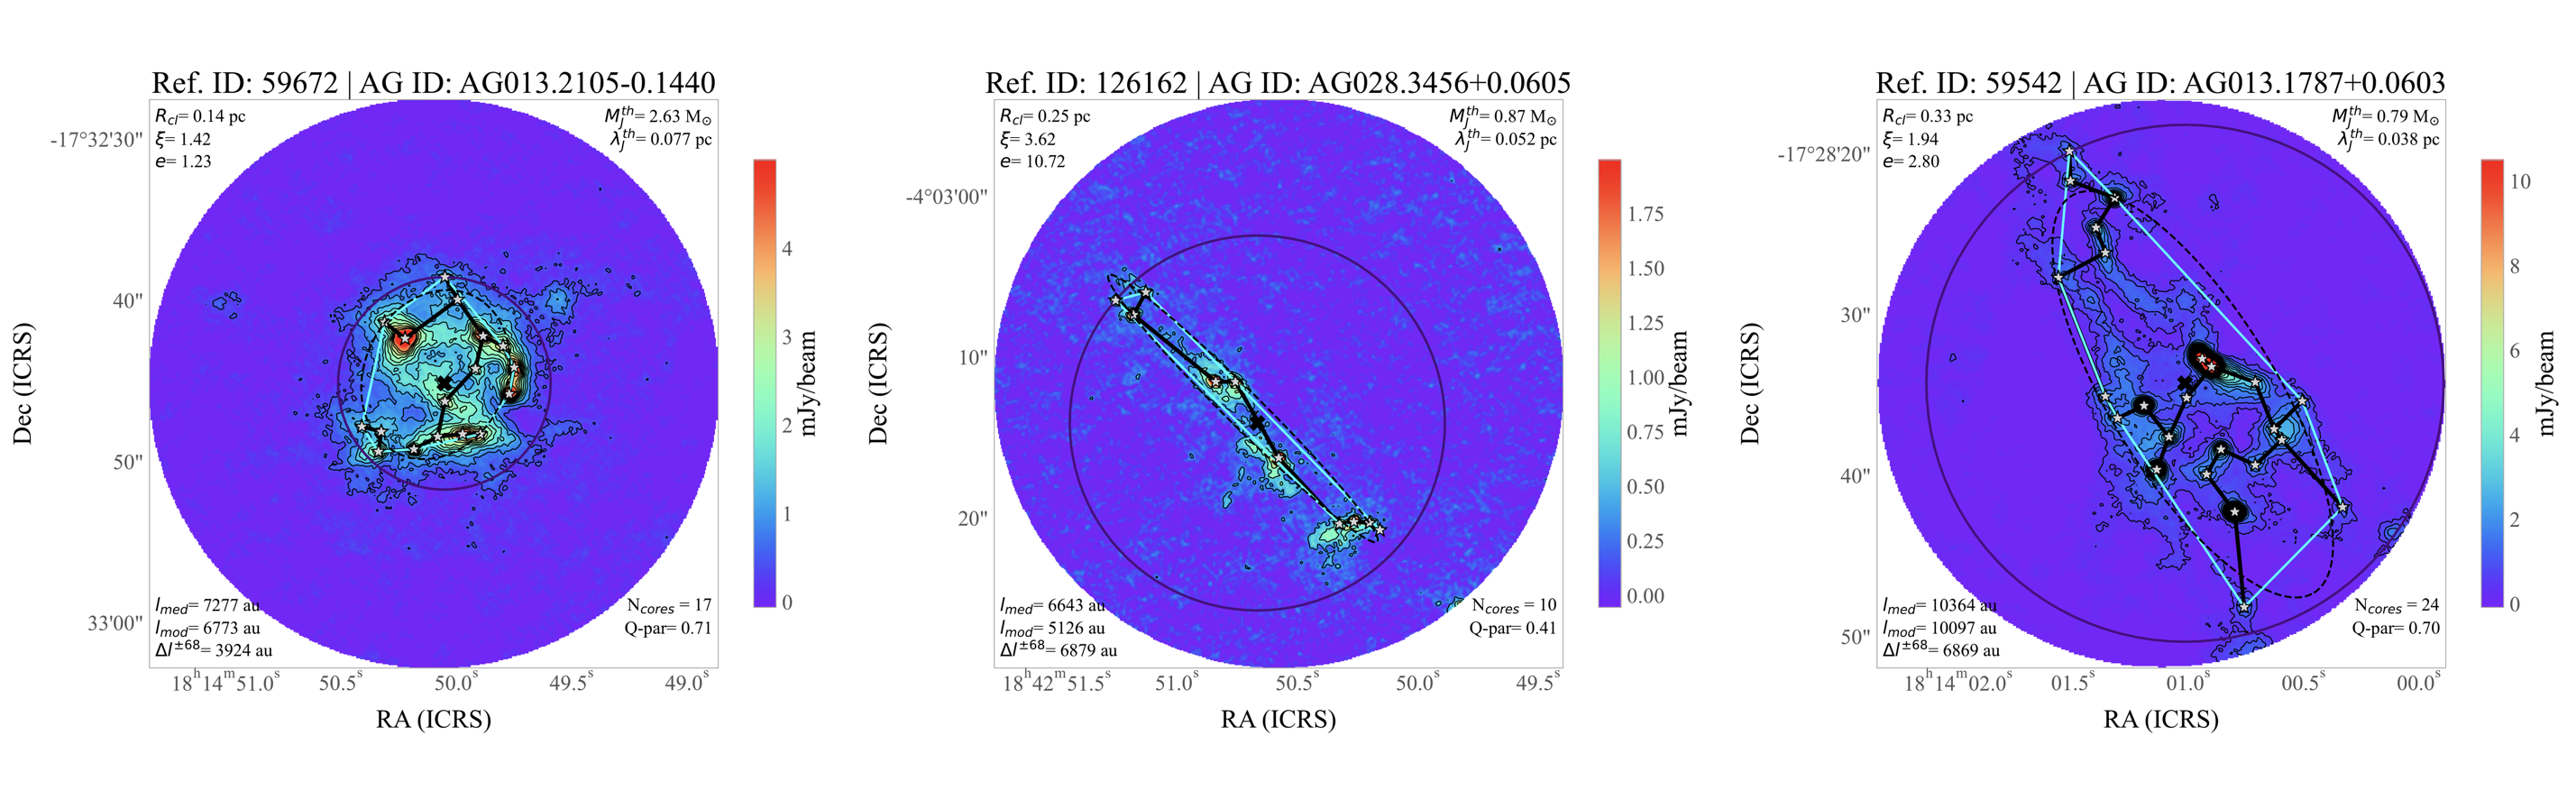
Spatial distribution of compact cores
Schisano et al. 2025 (download here) analyzed the spatial distribution of the compact cores identified in ALMAGAL fields at a scale of ~1000 au. The spatial distribution in each field has been characterized using several methods and indicators for targets with more than 4 compact cores identified, which corresponds to a total of 514 sources. Those fields can be visualized in the images shown in the page linked below. We also report the images for clumps with less than 4 cores (not included in the analysis of the paper), for which only a subset of the analysis and indicators is present.
Each figure shows the continuum emission at 1.3 mm of the ALMAGAL targets obtained by combining data from the 12m (compact and extended configurations) and 7m arrays. The positions of the ALMAGAL cores in the field are indicated with gray star symbols. The black contours correspond to intensity levels of 4σ, with σ equal to the noise measured in each map. Thick solid black lines show the minimum spanning tree (MST) edges connecting the cores detected in the field, which trace their spatial distribution. The cluster geometrical center and the cluster radius, Rcl, are indicated with a black cross and a dark blue circle, respectively. Lastly, the cyan lines show the convex hull (CH) polygon derived from the distribution of cores, while the black dashed line corresponds to the best-fit ellipse to the CH.
For clumps with more than 4 compact cores we report several quantities in the figure:
- Rcl is the cluster radius, defined as the distance of the farthest core from the cluster geometrical center.
- ξ is the cluster elongation, computed as the ratio between Rcl and the equivalent radius of the convex hull polygon according to the definition of Schmeia & Klessen (2006).
- e is the elongation, computed as the axis ratio of the ellipse best fitting the CH polygon.
- MthJ and λthJ are the thermal Jeans mass and length, computed from the clump-averaged properties.
- lmed is the median of the distribution of projected separations.
- lmod is the mode of the continuous distribution P(l), derived by applying a Gaussian Kernel Density Estimate to the measured projected separations.
- Δl is the width of P(l), defined at 68% of the peak intensity of the continuous distribution.
- Ncores is the number of detected cores in the clump from Coletta et al. (2025).
- Q-par is the value of the Q-parameter computed for the spatial distribution of the ALMAGAL cores.
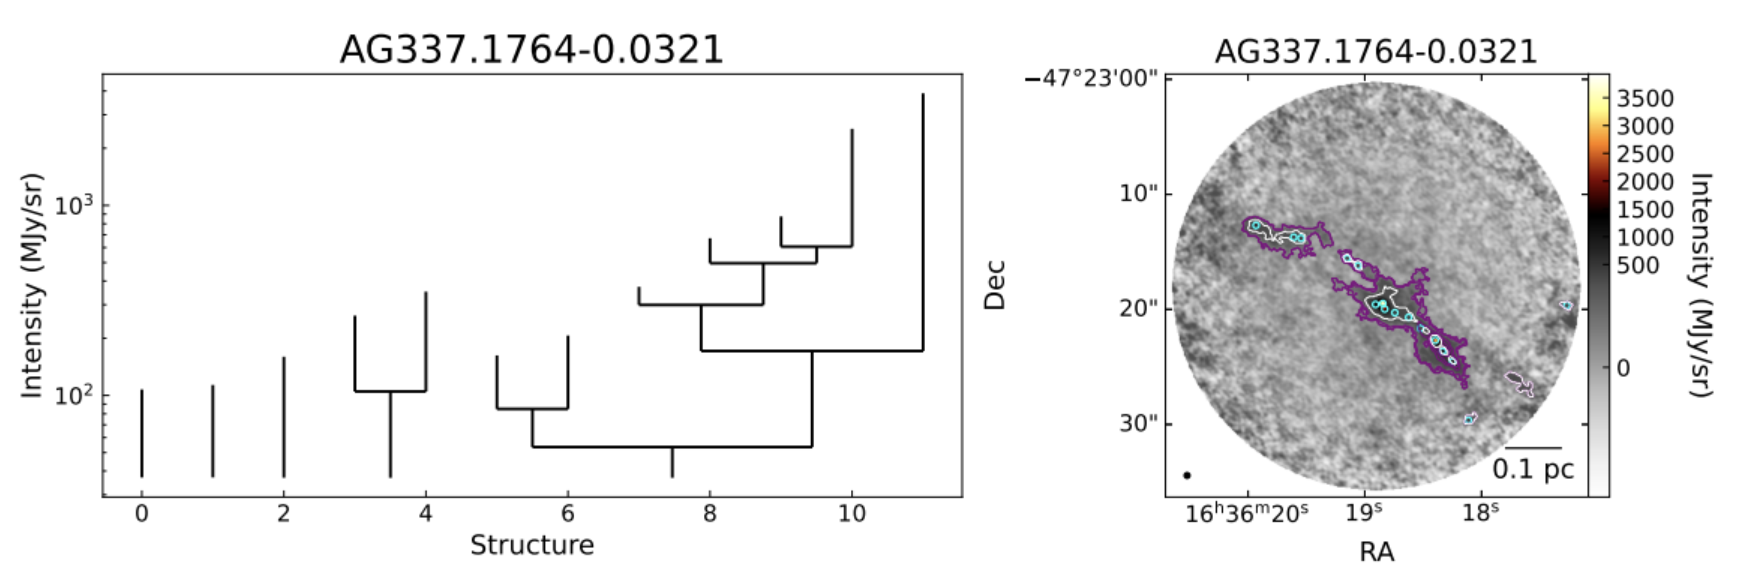
Hierarchical Continuum Structure from Cores to Clumps
Wallace et al. 2026 (download here) analyzed the structure of the continuum emission of the ALMAGAL targets to investigate the multiscale fragmentation of dense clumps into compact cores. The analysis was performed using astrodendro on a uniform linear resolution (2000 au) version of the continuum data. Using a common linear resolution of 2000 au allow to analyze the 90% of the ALMAGAL sample, for a total of 904 sources. The catalog of hierarchical structure is available in Zenodo.
Using astrodendro, we identify 5160 structures across 904 dense clumps targeted in the ALMAGAL survey. These structures have effective radii spanning 800–42000 au and cover multiple orders of magnitude in mass, from 0.05–670 M⊙. We utilize the dendrogram calculated for each clump to classify it according to its relative level of morphological complexity. Of the 900 clumps for which we have measured properties, we have 191 (21.2%) Empty clumps, 445 (49.4%) Isolated clumps, 187 (20.8%) Simple clumps, and 77 (8.6%) Rich clumps, in the order of increasing hierarchical fragmentation.
The images of the hierarchical structures are shown at the link below. For each source the left panel is the dendogram structure identified in the source, while on the right panel the continuum emission at 2000 au resolution is shown. Purple contours indicate the branch structures identified by the dendrogram algorithm in each region, while white contours indicate the leaf structures. Cyan circles indicate the position of cores from the ALMAGAL core catalog (A. Coletta et al. 2025).